Annual Report
Graphic Design & Company Performance Communication

Project Overview
Haltech is a regional innovation centre that supports startups and growing technology companies through programming, funding support, and partnerships. The annual report plays a key role in communicating Haltech’s impact to the public, partners, stakeholders, and board members.
The objective of this project was to design an annual report that clearly and professionally communicated Haltech’s activities and impact, while remaining visually engaging and easy to understand for a broad audience.
Project Scope
Graphic Design
Branding
Performance Review
Applications & Tools
Adobe InDesign
Adobe Illustrator
Duration
Start – July 2023
End – August 2023
Building The Report
Problem Statement
Annual reports often contain dense information that can be difficult to scan and interpret, especially for readers who are not deeply familiar with the organization. While there were no major usability issues with previous reports, there was an opportunity to improve clarity, visual hierarchy, and storytelling.
The challenge was to present complex organizational data and achievements in a way that felt accessible, visually consistent with Haltech’s brand, and meaningful to both casual readers and key stakeholders.
Users & Audience
The report was designed primarily for:
-
Members of the general public following Haltech
-
Partners and stakeholders reviewing organizational impact
-
Board members and event attendees looking for clear summaries of progress
Design decisions were made to ensure information could be quickly scanned while still offering depth for readers seeking more detail.
My Role
I was responsible for the end to end design and assembly of the annual report. My work included:
-
Designing all visual assets and layouts
-
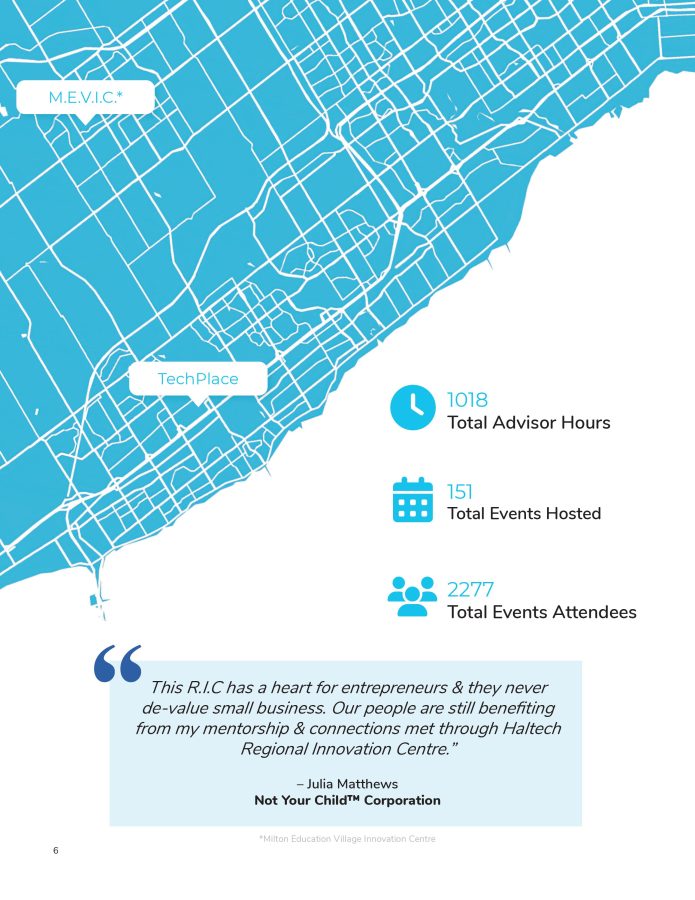
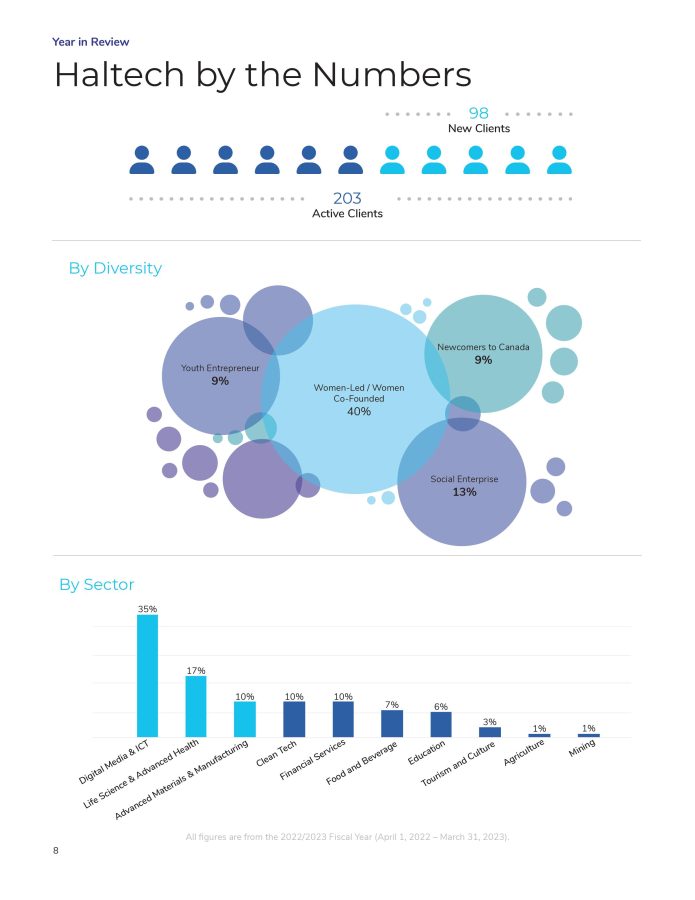
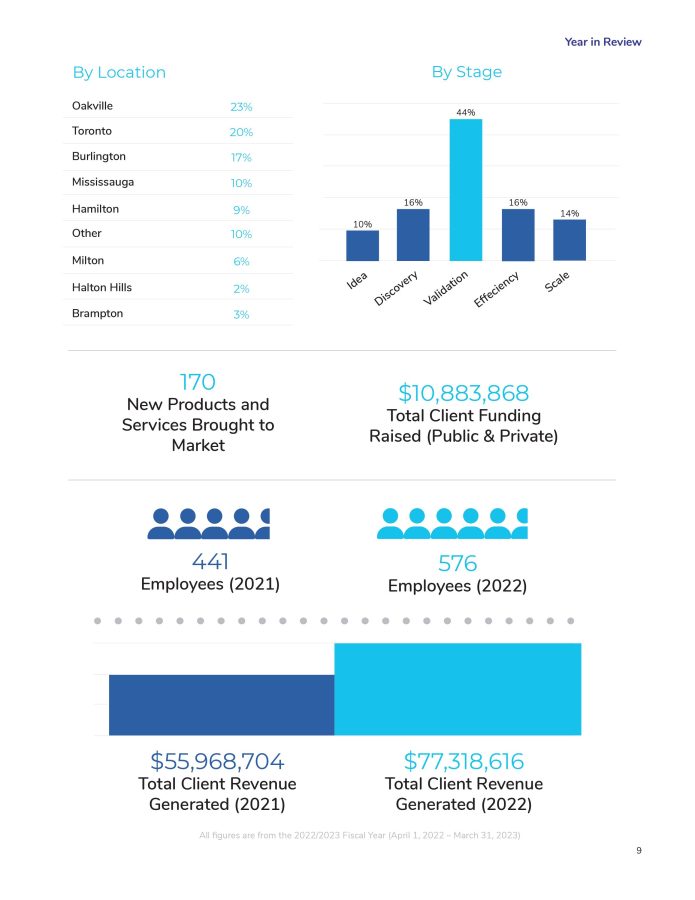
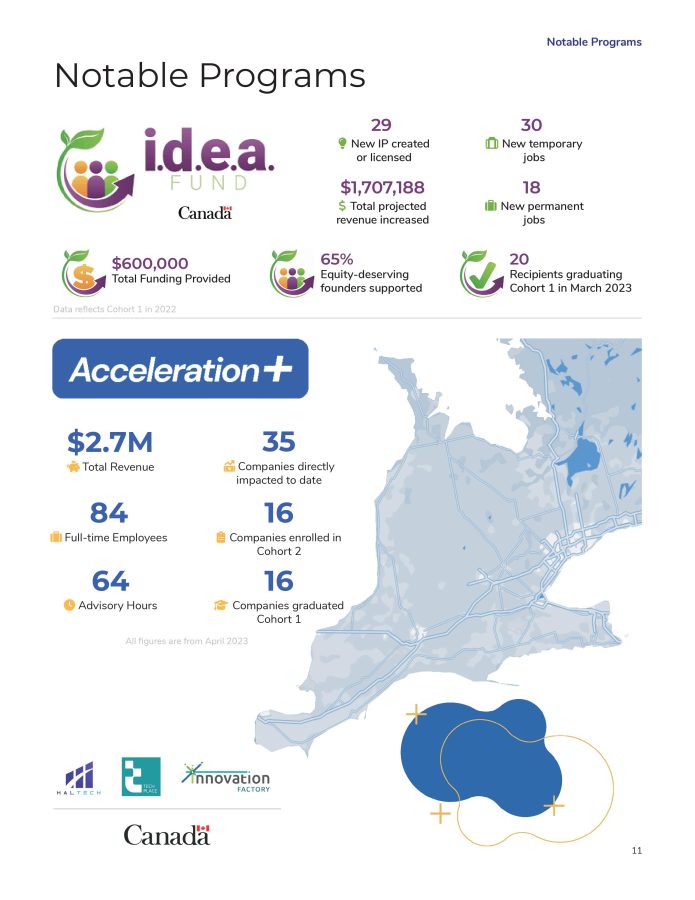
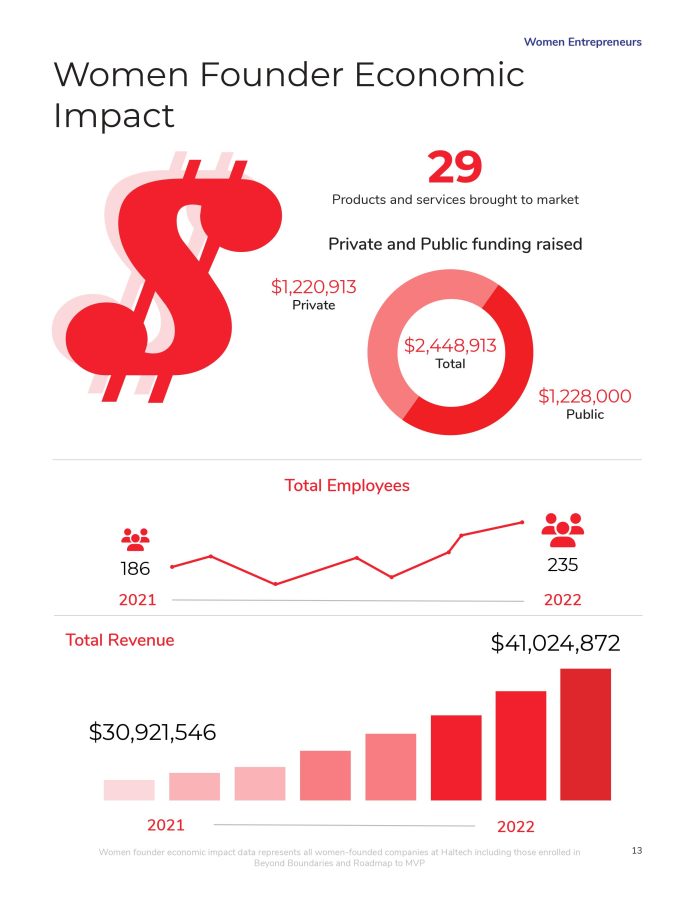
Creating charts and data visualizations using internal company data
-
Rewriting company statements and authoring supporting content
-
Assembling the full report in Adobe InDesign
This required close coordination with internal teams to gather accurate information and translate it into clear, visually structured content.


Design Process
Content Structuring and Information Hierarchy
The process began by reviewing all provided content and identifying key themes and outcomes Haltech wanted to highlight. I organized information into logical sections and established a clear hierarchy so readers could quickly understand what was most important.
Visual Design and Data Visualization
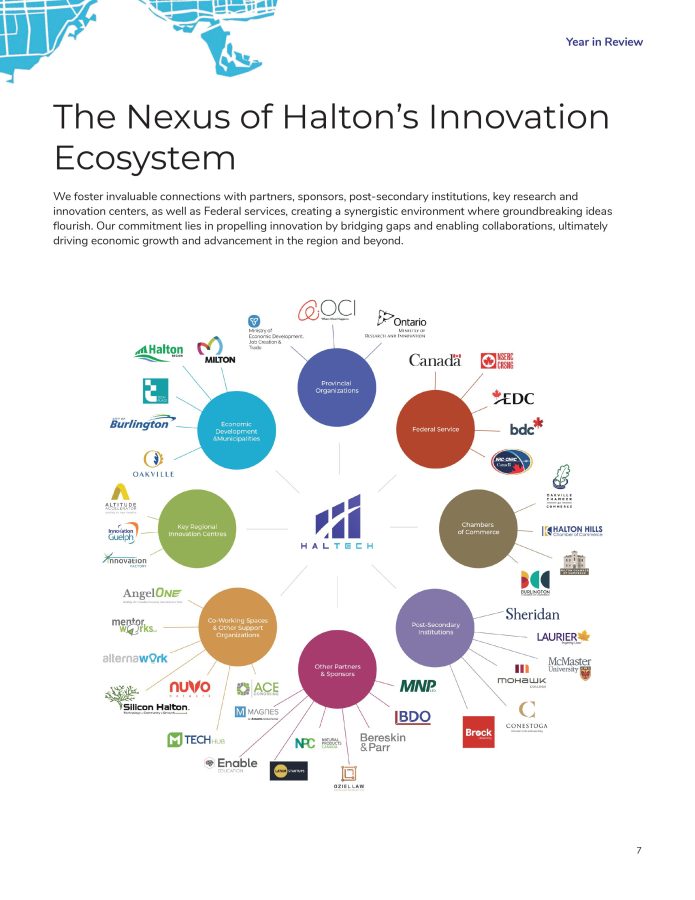
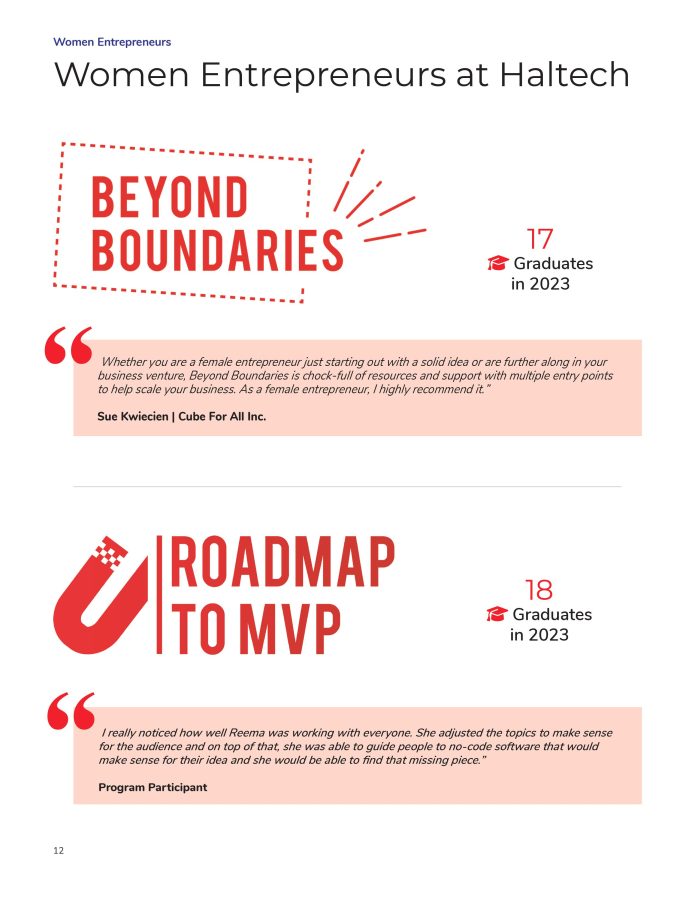
Using Haltech’s existing brand guidelines, I designed layouts that felt professional and consistent while remaining visually engaging. Data was translated into charts and graphics that prioritized readability and comparison, making complex information easier to interpret at a glance.
Assembly and Refinement
The full report was assembled in InDesign, where spacing, alignment, and visual rhythm were refined to create a smooth reading experience. Throughout the process, I balanced visual appeal with clarity to ensure the report remained functional as an informational document.
Key Descision Criteria
-
Used strong information hierarchy to guide readers through complex content
-
Designed charts and graphics to make data more approachable and scannable
-
Maintained strict alignment with Haltech’s brand guidelines for consistency
-
Balanced visual interest with readability to support both quick scanning and deeper reading
Each decision was made to help users understand Haltech’s impact without feeling overwhelmed.

Outcome & Impact
The final annual report made Haltech’s achievements and programs easier to understand and more engaging to explore. Complex information was clearly visualized, allowing readers to quickly grasp key outcomes and successes from the year.
The report brought additional attention to highlighted companies and programs, helping stakeholders better understand Haltech’s role in supporting innovation across the region.
Project Gallery